Page 112 of 126
Re: A Competitive GW (Solo) Scenario by the Numbers.
Posted: Mon Aug 17, 2026 8:20 pm
by rkr1958
Turn 20. Nov/Dec 1942. End of Turn.
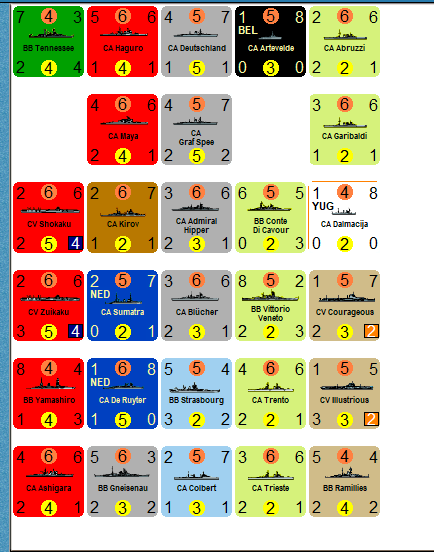
Warships Sunk To-Date.
- 99-Sunk-Warships.png (63.1 KiB) Viewed 861 times
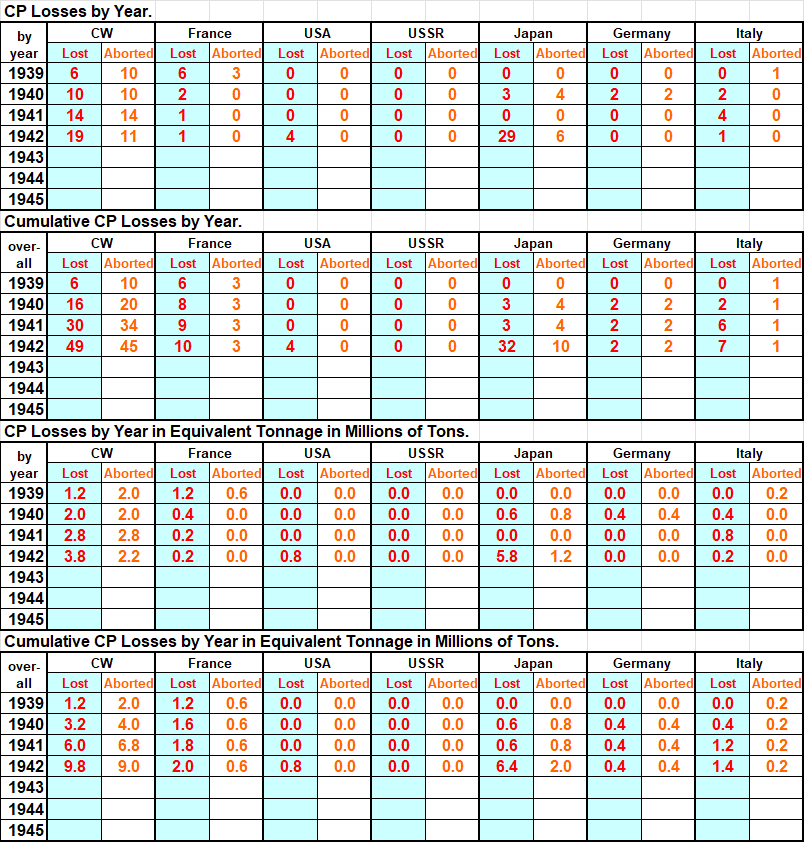
CP Loss Table.
- 99-CP-Losses-Table.png (60.7 KiB) Viewed 861 times
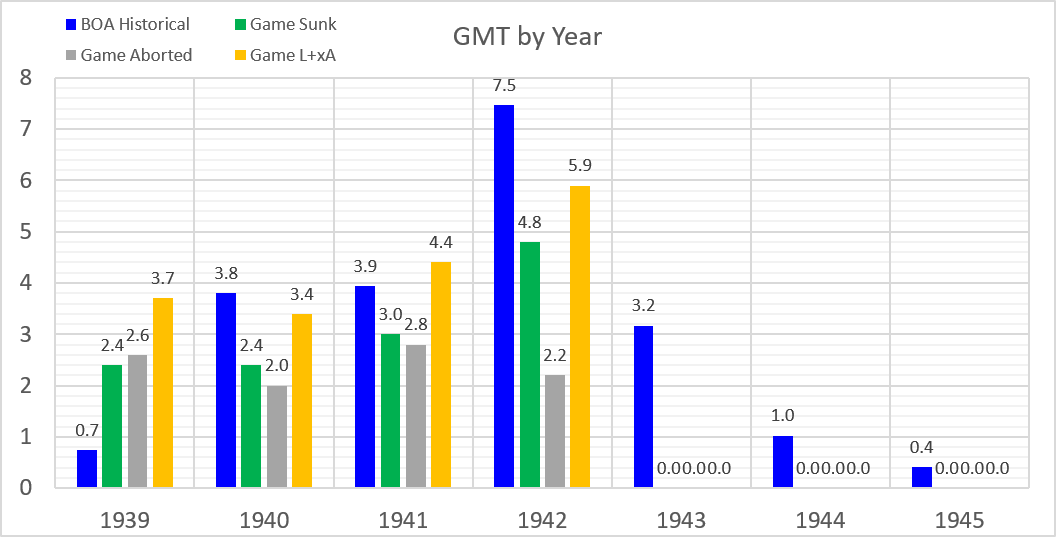
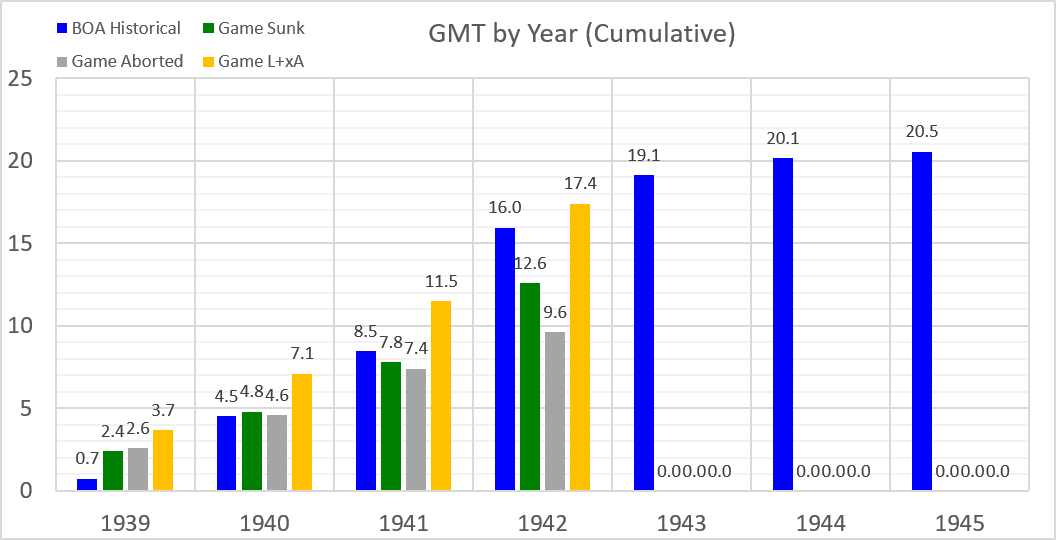
BOA (Game vs Historical).
(1) I've added a 4th (3rd game) bar - Game L+xA -> Game Loss + 0.5 x Aborted.
(2) I'm trying to come up with a metric that combines game CPs sunk & aborted in order to compare to historical Western Allied BOA losses.
(3) One caveat for the Western Allied game numbers present, they include Western Allied (CW, French & US) losses for the Atlantic, Med & Pacific.
(4) Though, Atlantic losses (sunk & abort) do dominate those totals.
(5) Maybe a second caveat, x = 0.5; so I'm counting a CP abort as 1/2 a sink.
- 99-BOA-GMT-YR.png (28.11 KiB) Viewed 861 times
- 99-BOA-GMT-Cumulative.png (28.18 KiB) Viewed 861 times
Re: A Competitive GW (Solo) Scenario by the Numbers.
Posted: Mon Aug 17, 2026 8:29 pm
by rkr1958
Turn 20. Nov/Dec 1942. End of Turn.
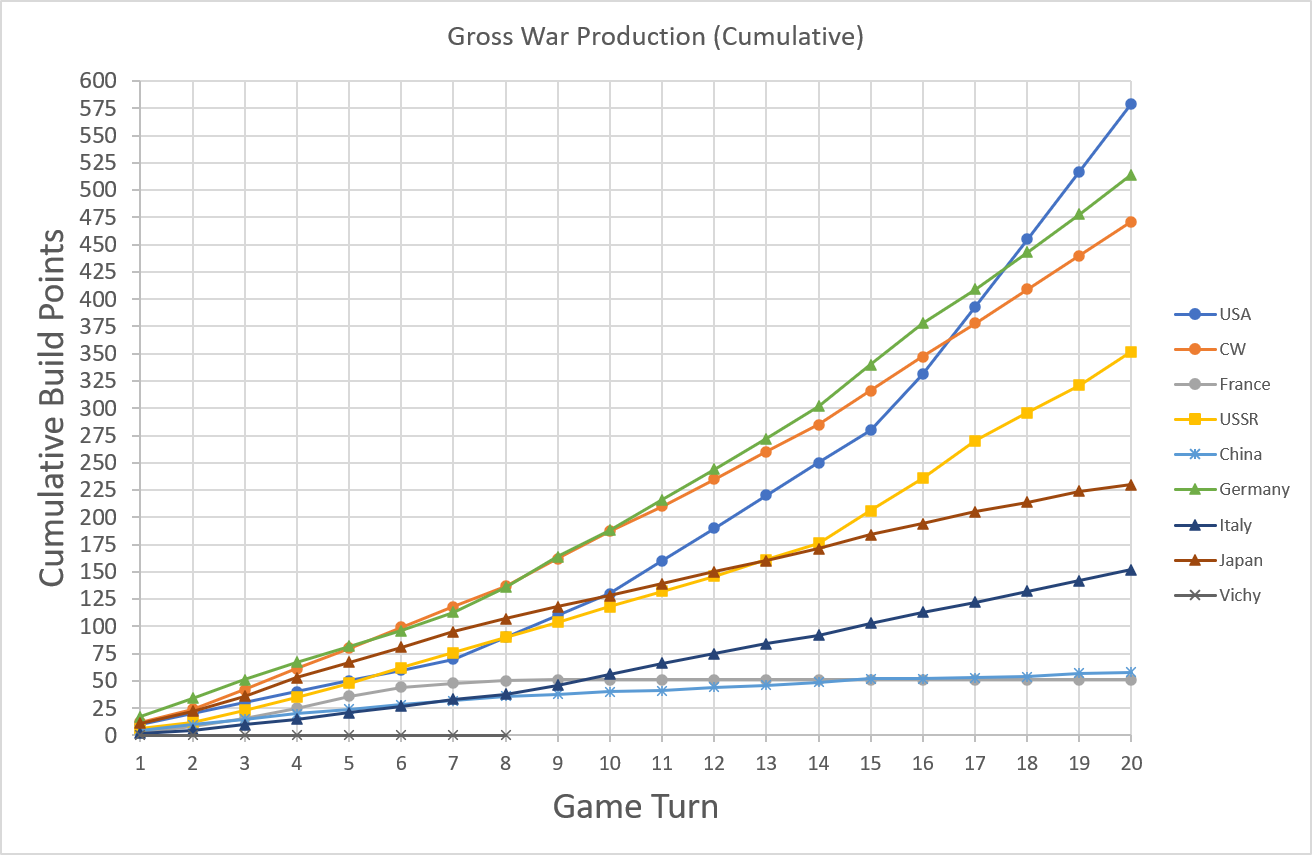
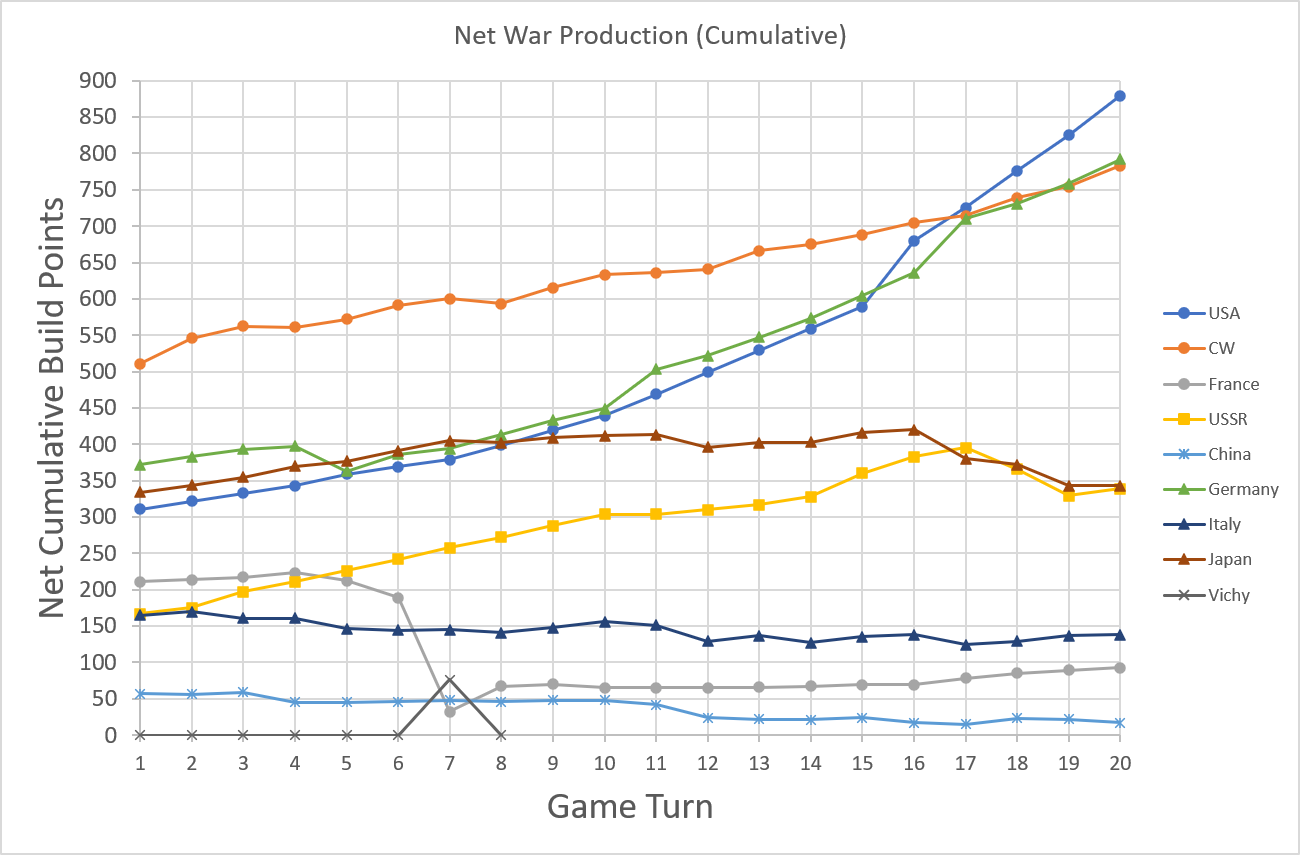
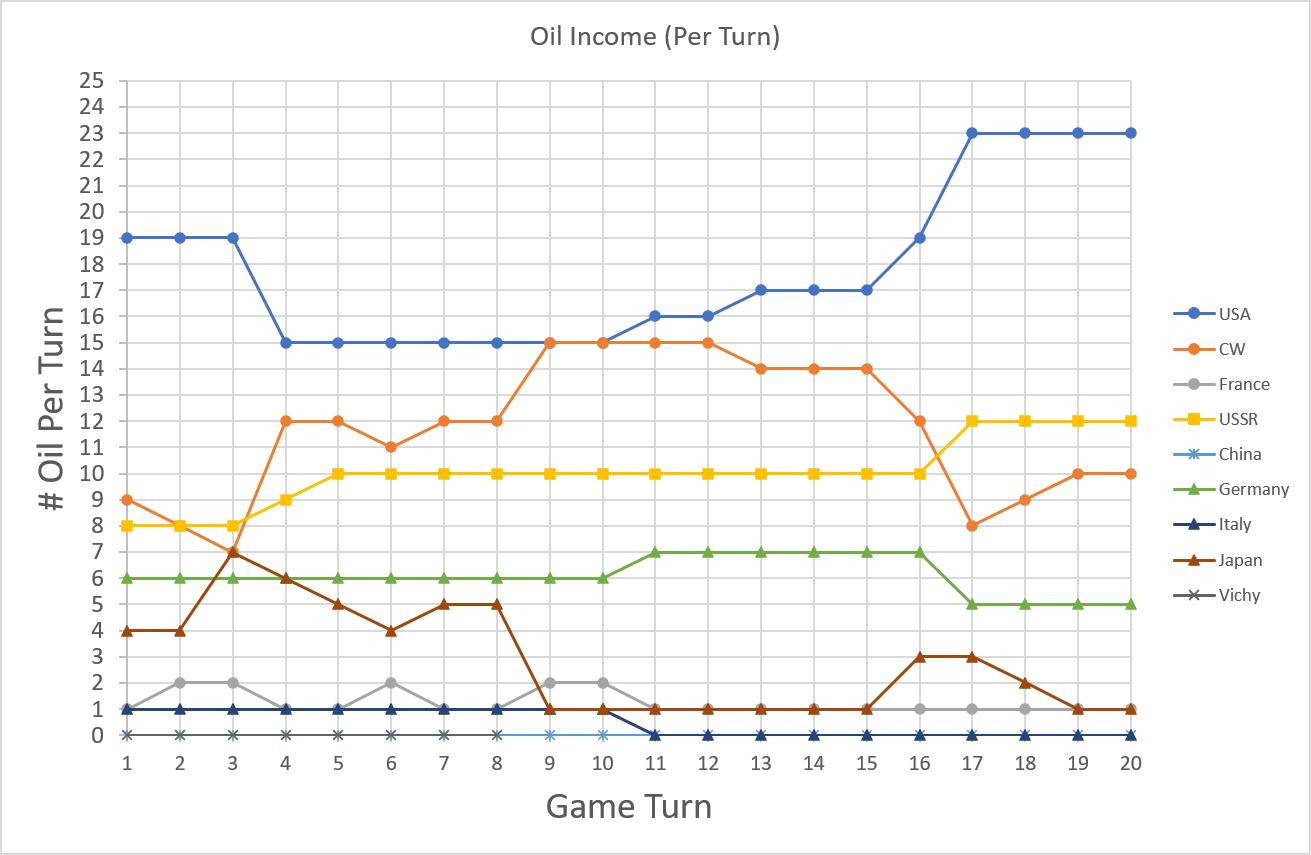
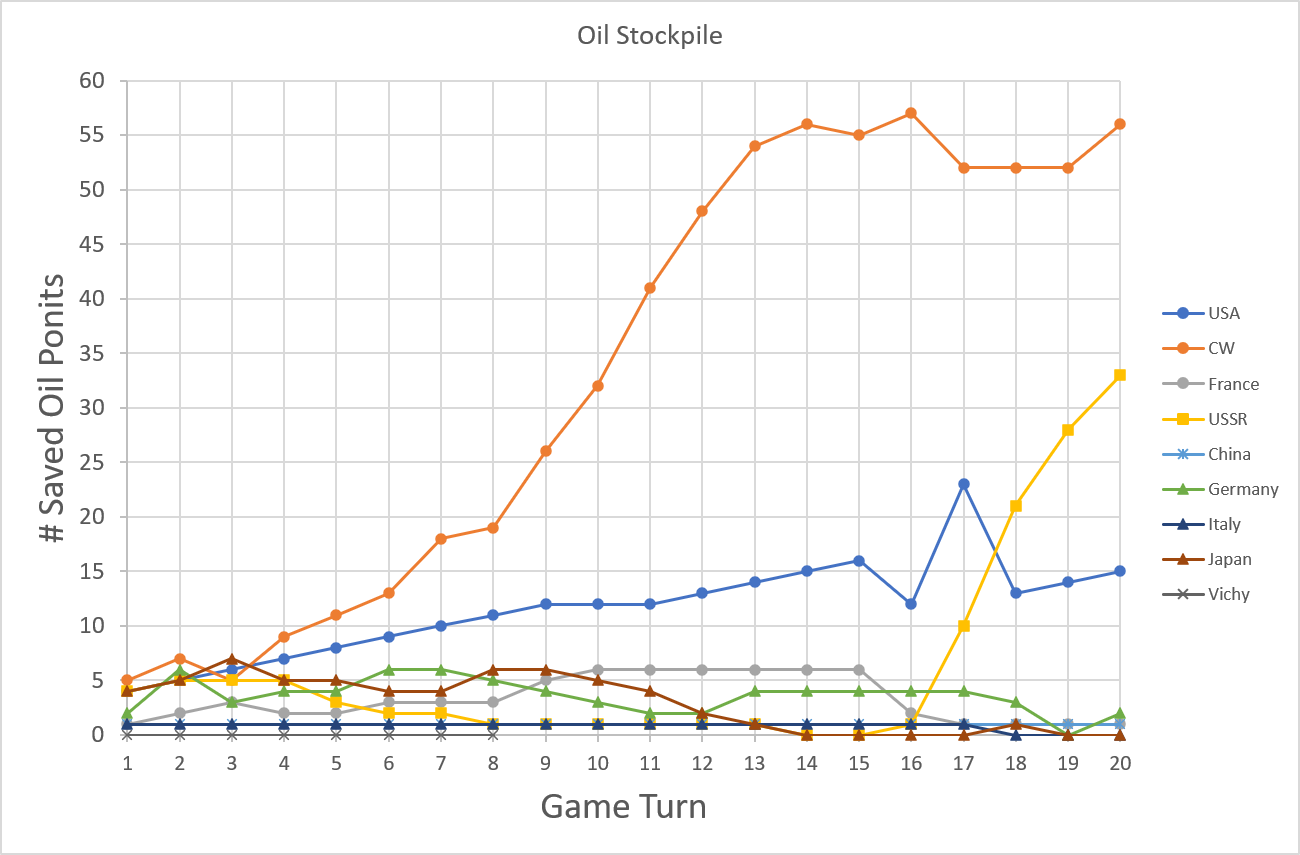
Economic & Oil Plots.
(1) Gross cumulative BPs are the total BPs generated for builds (i.e., after trade) for each major power, plotted per turn.
(2) Net cumulative BPs include the starting values of each MPs armed forces + BPs produced after trade - BP losses (units destroyed, ships damaged, saved BPs captured or lost, ships captured or lost, supply units captured or lost).
(3) Net cumulative BPs represent the economic value of a major powers armed forces in play & in production.
(4) In other words, the health of a major power's armed forces.
- 99-Gross-Cumultiave-BP.png (122.21 KiB) Viewed 858 times
- 99-Net-Cumulative-BP.png (113.59 KiB) Viewed 858 times
- 99-Oil-Income.png (78.18 KiB) Viewed 858 times
- 99-Oil-Stockpile.png (89.87 KiB) Viewed 858 times
Re: A Competitive GW (Solo) Scenario by the Numbers.
Posted: Mon Aug 17, 2026 8:32 pm
by rkr1958
Turn 20. Nov/Dec 1942. End of Turn.
Victory Total/Points.
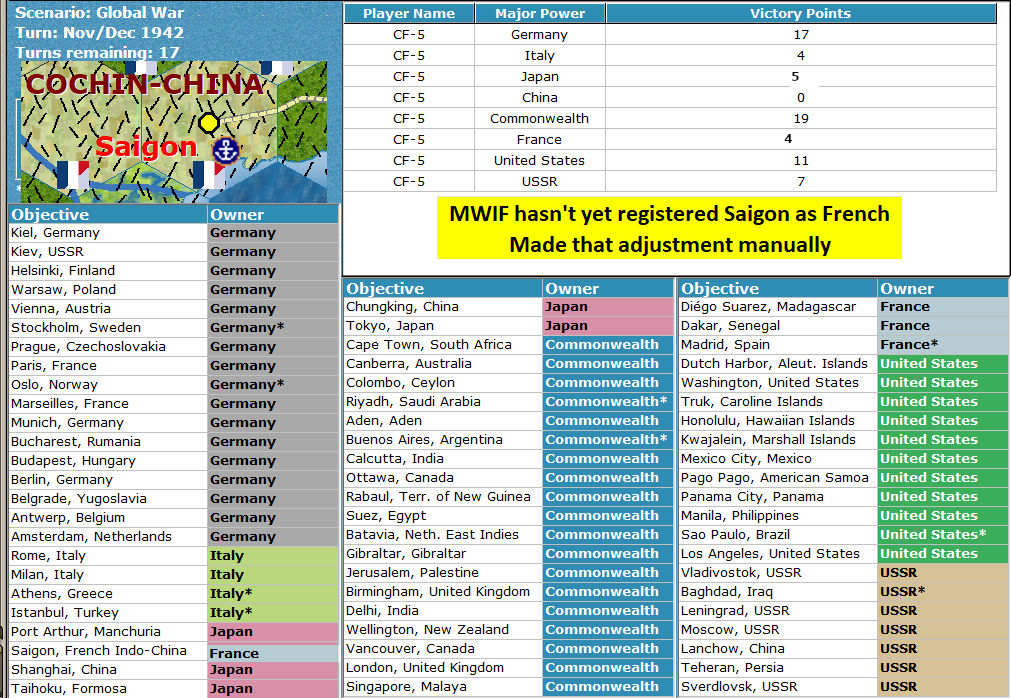
- 99-VT-1.png (220.49 KiB) Viewed 857 times
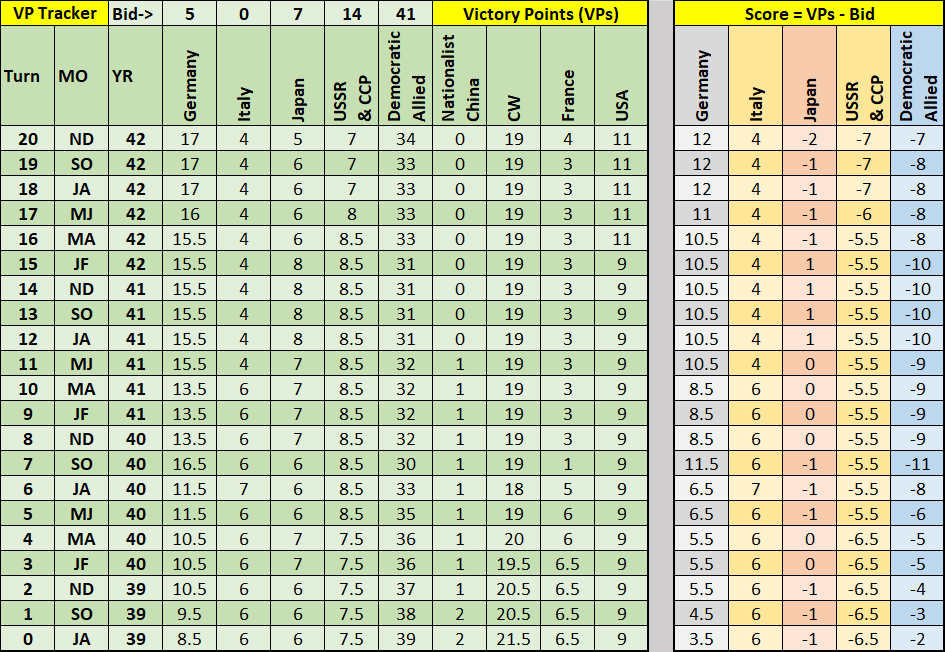
- 99-VP.png (85.02 KiB) Viewed 857 times
Re: A Competitive GW (Solo) Scenario by the Numbers.
Posted: Tue Aug 18, 2026 3:43 pm
by rkr1958
Re: A Competitive GW (Solo) Scenario by the Numbers.
Posted: Thu Aug 20, 2026 8:36 pm
by rkr1958
Turn 21. Jan/Feb 1943. Allied #1. Allied Command.
Impulse #143. Actions.
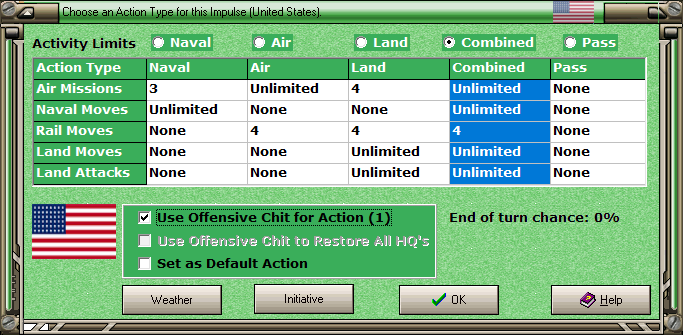
- 01-AL-US-Super-Combine.png (65.65 KiB) Viewed 788 times

- 01-AL-impulse-143.png (23.7 KiB) Viewed 788 times
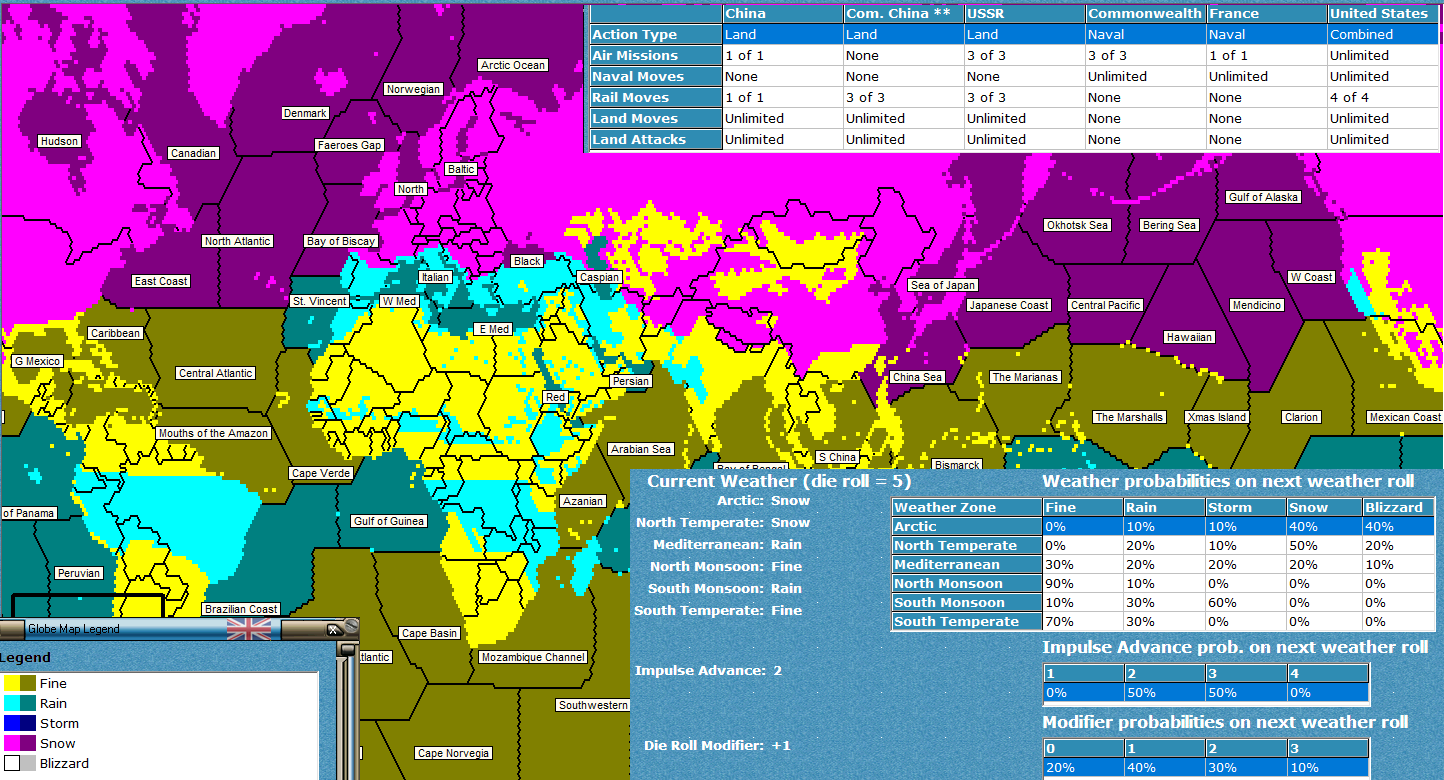
- 01-AL-Weather-Action-Map.png (184.15 KiB) Viewed 788 times
Re: A Competitive GW (Solo) Scenario by the Numbers.
Posted: Thu Aug 20, 2026 9:10 pm
by rkr1958
Turn 21. Jan/Feb 1943. Allied #1. Allied Command.
Western Allied. Naval Air Moves.

- 01-AL-Western-Naval-Air-CL.png (13.11 KiB) Viewed 785 times

- 01-AL-Western-Naval-Air-Moves.png (37.1 KiB) Viewed 785 times
Re: A Competitive GW (Solo) Scenario by the Numbers.
Posted: Fri Aug 21, 2026 8:19 pm
by rkr1958
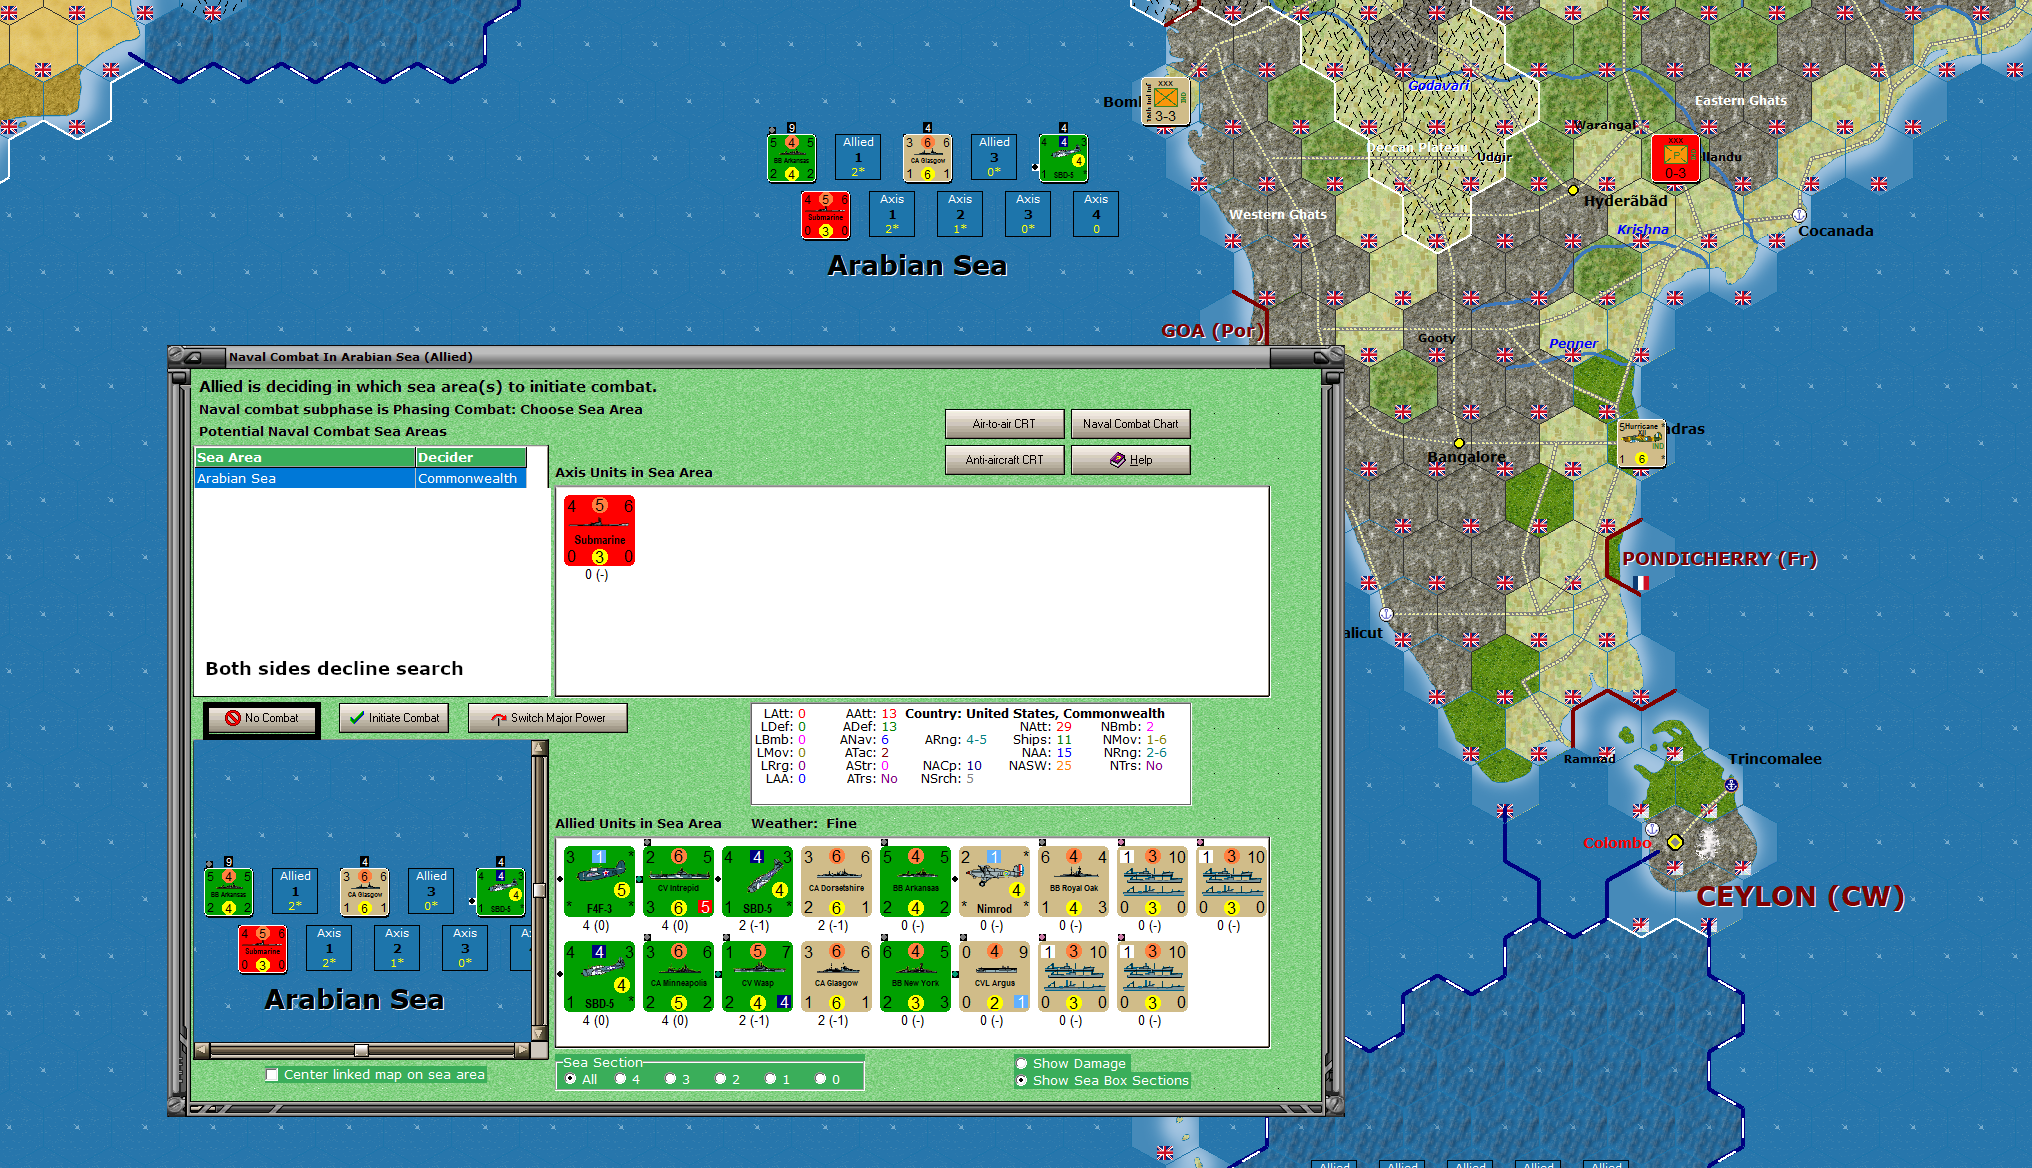
Turn 21. Jan/Feb 1943. Allied #1. CBI.
Arabian Sea.

- 01-AL-CBI-Arabian-Sea-NS-NC-CL.png (6.93 KiB) Viewed 724 times
- 01-AL-CBI-Arabian-Sea-NS-NC.png (1.04 MiB) Viewed 724 times
Re: A Competitive GW (Solo) Scenario by the Numbers.
Posted: Sat Aug 22, 2026 8:10 am
by Orm
rkr1958 wrote: Fri Aug 21, 2026 9:05 pm
For the LOVE OF ALL THAT IS MWIF, how many times do the WIF gods need to teach me this lesson?! No matter how favorable the naval situation is, do NOT search when a critical invasion/debark is scheduled!
MacArthur had a lucky escape.

Even if you had not searched, wouldn't Japan have searched anyway?